
Last updated on 20th October, 2019
Article summary
Here, we first talk about the R programming language, followed by the installation steps for getting started with R and its IDE – RStudio.
What is R?
R is an useful language to learn for Data Science. I generally use it while exploring the data and the feature engineering part. It is little different from the programming languages you all had previously encountered like C, Java, Python.
The first course I followed was the MIT’s Analytics Edge on edX.
For quick reference, I found R-bloggers and AnalyticsVidya blog to be very relevant and useful.
There are some very important concepts that you surely need to know before getting started with R. They are : data frames
Setting up R and RStudio in Windows and Mac
Visit the following edX course page for the installation instructions.
Setting up R and RStudio in Linux (Ubuntu 18.04)
To setup the environment, first install r from the terminal. I use RStudio a the IDE, which is the next thing that you need to install.

R comes with a library, pre-loaded with some basic set of R packages. Along with that I will recommend you to install the following list of additional R libraries that2 will prove useful. They are : dplyr, ggplot2, data.table.
I am providing some small code fragments for dealing with the most popular tasks like oversampling, slicing and indexing of the dataset, as mentioned below. For the example codes, we will assume a dataframe “DF”, with columns “X1” and “X2”, have more than 1 observations or data points.
Shuffling your dataset
We generate a list having index from 1 to the number of rows in DF in line 1. We shuffle the list in line 2 and use this new shuffled list of indices to shuffle the dataframe.
DFindex = seq(1, nrow(DF))

DFindex_shuffled = sample(DFindex, length(DFindex), replace= FALSE)

DF_shuffled = DF[DFindex_shuffled, ]
Oversampling
library(ROSE)

DF_over = ovun.sample(X1~., data= DF, method="over", N=nrow(DF)*2)
Feature Engineering
Using the dplyr package. I found this post regarding dplyr in detail. This helps us perform SQL-like queries on a R dataframe. The most useful commands I came across were :
- select – When we want to work with only certain columns
newDF = DF %>% select(X1)
When we want to remove certain columns
newDF1 = DF %>% select(-X2)
2. arrange – Sorting the dataframe based on one or more columns. Default is “ascending” order.
newDF = DF %>% arrange(X1)

newDF1 = DF %>% arrange(X2, desc(X1))
3. mutate – Creating new columns based on old columns or simply some given pattern
newDF = DF %>% mutate(X3=X1+100)

newDF = DF %>% mutate(X4=sample(1:100, nrow(DF), replace=TRUE) )
4. group_by along with summarise – newDF will have number of rows equal to the number of unique values of X1. In the summarise function the arguments will always be a group function like max, min, sum, avg, median. n() is used to count the number of observations belonging to each group obtained by the group_by function.
newDF = DF %>% group_by(X1) %>% summarise(count = n())
Removing non-ASCII characters :
Using the “iconv” function from the default base package. This preprocessing is sometimes required before feeding the data into certain toolkits or softwares that are available like MetaMap. However, this step should be taken after deep consideration. In many cases, these non-ASCII characters plays as a significant feature for the model we are building.
DF$X1 = iconv(DF$X1, from="utf-8", to="ASCII", sub="")
Setting up your R environment :
In Ubuntu 18.04(Bionic Beaver) :
1. You first need to install r-base.
sudo apt -y install r-base
2. I recommend you to use RStudio as an IDE. There are alternatives to it, which I will write a review about in the future.
Download the .deb file(32 or 64-bit) from the Rstudio website. I recommend you to install gDebi from beforehand. For all installations, where you install in Ubuntu using the .deb file like TeamViewer, Slack Desktop, I advise you to use the gDebi package installer as it always installs the dependencies, and prevents from broken packages.
NOTE : Never use “Software Install” in this scenario, it may create broken dependencies
sudo apt-get install gdebi
Open the rstudio-xenial-1.1.453-amd64.deb file using gDebi Package Installer and select “Install package”.
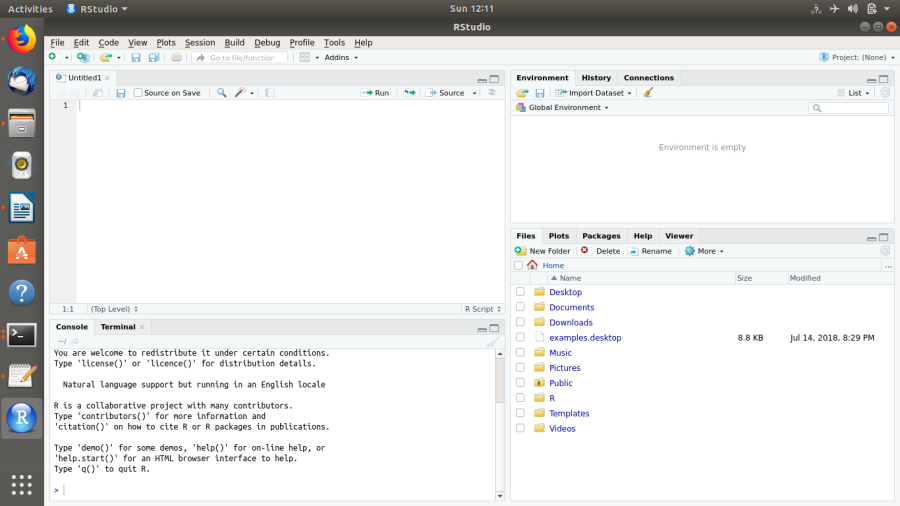
Open RStudio. In the right-hand bottom window, click on the Packages icon and dowload dplyr, ggplot2, ROSE.
If you are behind a proxy, follow the steps : Set system-wide or user-centric proxy. I am working with Bionic Beaver Ubuntu 18.04.
sudo gedit /etc/environment
Add the following lines :
http_proxy="http://172.16.2.30:8080/"

https_proxy="https://172.16.2.30:8080/"

ftp_proxy="ftp://172.16.2.30:8080/"

no_proxy="localhost, 127.0.0.1, ::1, 10.0.0.0/8, 10.14.1.203"
We need to make changes specific in R.
sys.getenv("http_proxy") or sys.getenv("https_proxy")
If it is not what you require, then :
sys.setenv(http_proxy="http://172.16.2.30:8080/") sys.getenv(https_proxy="https://172.16.2.30:8080/")
Then try once, installing the packages :
install.packages("dplyr")
If it still fails to connect to the url, try :
install.packages("dplyr", method="wget")
Some packages require Java as a part of it. So, we install it as follows :
sudo apt-get install default-jre
Further Reading
This dev.to post covers some more R packages that might prove useful
If you like the post or have some suggestions, please mention them in the “Comments” section below.